
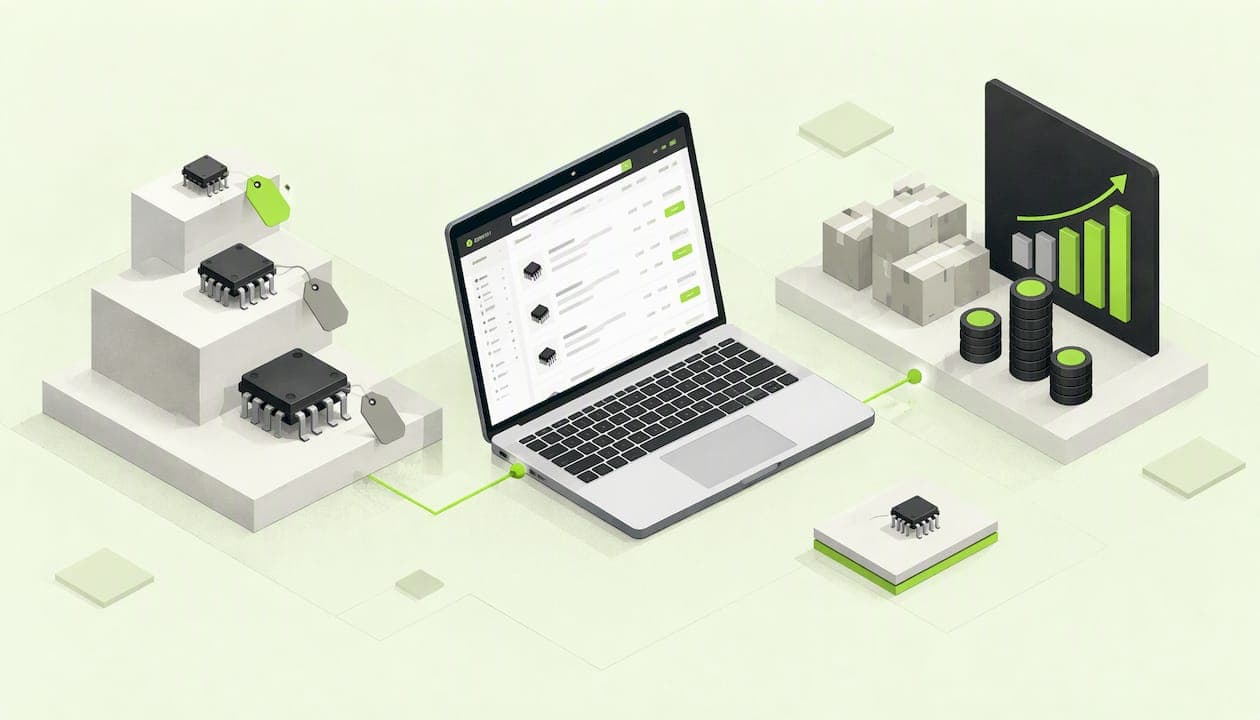
Digitize and enrich your BOM, rank lines by spend and supply risk, then pull technical and sourcing levers on the top drivers. Programs that combine both report 5–12% cost reduction. This afternoon: import your BOM, price it at target quantity, and flag the top lines for pilot replacements.
TL;DR:
- Price each line at 1, 10, 100, and 1,000 units, then include freight, duties, yield loss, inventory, and obsolescence in landed cost.
- Prioritize parts with flexible specifications and qualified alternatives; expensive capacitors with tight limits or one vendor are poor first substitution targets.
- Treat specification changes, distributor switches, and minimum order adjustments as quick wins, but start requalification, product consolidation, and board redesign early.
- Track captured versus identified savings, assembly unit cost, implementation time, supplier risk, and price regressions against a dated BOM snapshot for each release.
- Test substitutions in a pilot build and check reliability, lifecycle status, and yield before adopting a cheaper part that could increase scrap or requalification costs.
Table of Contents
- What costs belong in your BOM cost analysis?
- How do you analyze and rank BOM costs step by step?
- Which cost-reduction levers pay off first?
- How do you lock in savings with KPIs and governance?
- What does the evidence say about digital and AI-enabled BOM management?
- Where I would start
- How can you price and prioritize your BOM with Circuit Center?
- FAQ
- Sources
What costs belong in your BOM cost analysis?
A BOM analysis that stops at the unit price on the quote will miss most of the story. Capture the direct cost first, then the costs that quietly sit around it.
Direct and commercial costs:
- Component price at each tier you may buy at: 1, 10, 100 and 1,000 pieces, because a prototype run and a production run rarely share a price.
- Packaging format and minimum order quantity (MOQ). A large reel of resistors for a smaller build is real money on the shelf.
- Supplier and distributor spread. The same part often carries visibly different prices across sellers.
Hidden costs:
- Freight, duties and special handling for moisture-sensitive or static-sensitive parts.
- Inventory carrying cost and obsolescence write-offs on leftover stock.
- Yield and scrap at assembly, plus test fixturing and rework.
- Shelf-life expiration and warranty exposure from marginal parts.
Metadata to attach to every line:
- Manufacturer part number, supplier and package.
- Lifecycle status (active, not recommended for new designs, end of life).
- Lead time and MOQ.
- Compliance constraints such as RoHS or REACH, and any spec limits that stop substitution.
Without lifecycle and lead time on each line, you cannot tell a cheap part from a cheap part that will stall your build. Collect these fields once, at the start, and every later step gets easier.
How do you analyze and rank BOM costs step by step?
Run this process the same way every time so results are comparable between programs.
- Digitize and normalize. Load the BOM from a spreadsheet or a KiCad, Altium or Eagle export. Match each line to a real manufacturer part number, merge duplicates that differ only in reference designators, and flag lines that cannot be matched.
- Enrich with market data. Pull price and stock at 1, 10, 100 and 1,000 pieces from several distributors. Keep track of whether a price comes from a live feed or an older listing, and record lead times.
- Compute landed unit cost. Add freight, duties and an allocation of test, yield loss and overhead to each line. The goal is a total cost view, not a catalog price.
- Pareto and risk-score. Rank lines by extended cost, then score each on value, how modifiable the spec is, and supply risk. Usually a small share of lines carries most of the spend.
- Form prioritized experiments. For each top candidate, name an owner, the expected savings and a timeline.
Pro Tip: Score "modifiable" honestly. A capacitor with a tight spec and one qualified vendor is a poor first target, however expensive it looks. A generic part with loose tolerances and five equivalents is where quick savings live.
The output of step 5 should be short: a ranked table of priority lines, each with a hypothesis ("swap to an equivalent in a larger package", "split the buy across two distributors"). If a candidate has no hypothesis and no owner, it is not an opportunity yet.

Which cost-reduction levers pay off first?
Order levers by savings potential against effort, then work down the list. Industry analysis suggests that more than half of the savings potential sits in design, process and supplier economics rather than price negotiation alone, so do not start and end at the buyer's desk.
Engineering levers:
- Relax specs on noncritical parameters: a 1% resistor where 5% would do, or a commercial-grade part where industrial grade is not required.
- Substitute package or grade after checking thermal and layout impact.
- Cut unique part variants. Every extra value is another reel, another line item and another chance of a stock-out.
- Apply design for manufacturing (DFM) changes that simplify assembly.
Standardization and rationalization:
- Consolidate parts across products and variants so volumes aggregate and pricing tiers improve. BOM rationalization has produced measurable material-cost reductions in real cases, and it also cuts excess inventory.
Sourcing and commercial levers:
- Qualify second sources for high-spend lines so you can negotiate from a real alternative.
- Aggregate volume across programs and consider long-term agreements for stable parts.
- Build a should-cost model: estimate what a part ought to cost from its process steps, materials and labor, then use it to test a supplier's quote.
Manufacturing and process levers:
- Improve first-pass yield on the lines with the highest scrap cost.
- Trim test coverage that duplicates earlier checks.
- Simplify assembly steps that need manual handling.
BOM-centered programs can unlock 5–12% cost reduction when technical and commercial levers are addressed together, according to Inverto's analysis. Treat it as a range to test against your own baseline, not a promise.
To sequence the work, sort each initiative into two buckets. Quick wins (spec relaxation, a second distributor, an MOQ change) can land within a build cycle. Multi-quarter projects (requalifying a substitute, consolidating across programs, a board respin) need engineering time and approval, so start them early and track them separately. When you weigh a substitution, check reliability and lifecycle alongside price: a part that is cheaper but nearing end of life may still be a loss. Design changes also ripple outward, so cost a change against performance, rework and requalification before committing.
How do you lock in savings with KPIs and governance?
Identified savings only matter once they reach the P&L. Give engineering, procurement and finance explicit shared ownership, and meet on a fixed cadence, such as a regular, short value-engineering sprint. Engineering owns feasibility, procurement owns the commercial side, and finance confirms the number is real.
Track a small set of KPIs:
- Savings identified versus savings captured.
- Unit cost trend per assembly over time.
- Implementation lead time from idea to released change.
- Supplier risk, such as single-source share and lead-time drift.
- Cost regressions, meaning prices that creep back after a deal.
Pro Tip: Freeze a version-controlled BOM snapshot at each release. Without a dated baseline, nobody can prove what a change saved, and savings get argued away.
Automate the repetitive checks: alerts for price changes, scheduled re-pricing at your chosen quantities, lifecycle and obsolescence watches, and snapshots on every revision. Then convert each opportunity into an initiative with one line: owner, scope, baseline cost, target savings, timeline. For example: "Dana, replace the 12 ceramic capacitor variants with 4, baseline $0.84 per board, target $0.19 per board, two quarters." That line is easy to audit and hard to forget.
What does the evidence say about digital and AI-enabled BOM management?
Advisors now treat the BOM as a profit lever rather than an engineering afterthought. AI-enabled workflows give teams transparency into supplier economics (process steps, machine utilization, labor), so they can challenge a cost model and set an objective baseline instead of relying on outdated quotes. That objective baseline is what turns a should-cost model from a spreadsheet exercise into negotiating leverage, and it speeds up spotting technical levers across BOM lines.
BOM-centered programs can unlock 5–12% cost reduction when technical and commercial levers are addressed together. Inverto, on the bill of materials as a profit engine
Market conditions raise the urgency. In power infrastructure, the IEA reports that procurement now takes two to three years for cables and up to four years for large power transformers, amid rising component prices. That sector differs from electronics, but the lesson carries: when prices climb and lead times stretch, a team that monitors its BOM continuously reacts sooner than one that reprices once a year.
Where I would start
Three priorities, in order. First, run a small pilot on your highest-spend subsystem and measure realized savings before you scale the program. A pilot you can finish teaches more than a plan you cannot. Second, target parts with modifiable specs and real alternative sources, and leave single-source critical components for later, because a hard-won discount on a part you cannot replace is fragile. Third, make every saving traceable in the P&L and protect it with a design control or a contract, or it may drift back.
— Matthew
How can you price and prioritize your BOM with Circuit Center?

We built our BOM tool for exactly this workflow. You bring a spreadsheet or a KiCad, Altium or Eagle export, and we match each line to real parts and price the build at your quantity, with a recommended supplier per line. The file is read in your browser; only part numbers are looked up.
- Digitize: import the file and let us match every line.
- Enrich: compare price and stock across distributors at 1, 10, 100 and 1,000 pieces, with live feeds marked apart from older listings.
- Prioritize: review the priced list to identify potential candidates.
- Pilot: share the priced list with a colleague or buyer by link.
Try this experiment today: import one BOM, price it at prototype and production quantities, and review the highest-priority lines for redesign or supplier talks. If you work from design files, the Circuit Designer prices a KiCad BOM straight from the schematic. Start at Circuitcenter.
FAQ
What does BOM stand for in manufacturing?
BOM stands for bill of materials, the structured list of every part, material and quantity needed to build a product. In electronics it usually carries reference designators, manufacturer part numbers and package details.
What techniques reduce BOM costs most reliably?
The most dependable techniques combine design and commercial levers: relaxing noncritical specs, cutting unique part variants, qualifying second sources, and aggregating volume. Programs that pair technical and commercial levers report 5–12% cost reduction.
What is a should-cost analysis?
A should-cost analysis estimates what a part ought to cost from its materials, process steps, machine time and labor, rather than from a supplier's quote. You then compare it against the quote to find negotiating room.
How do I decrease production costs without hurting quality?
Start with the top-spend lines and check lifecycle, spec limits and qualified alternatives before changing anything. Pair each swap with a pilot build and a yield check, so a lower price does not become higher scrap.
Sources
- Bill of Materials: Unlock up to 12% Cost Savings | Inverto
- Rising component prices and supply chain pressures are hindering the development of transmission grid infrastructure - IEA