
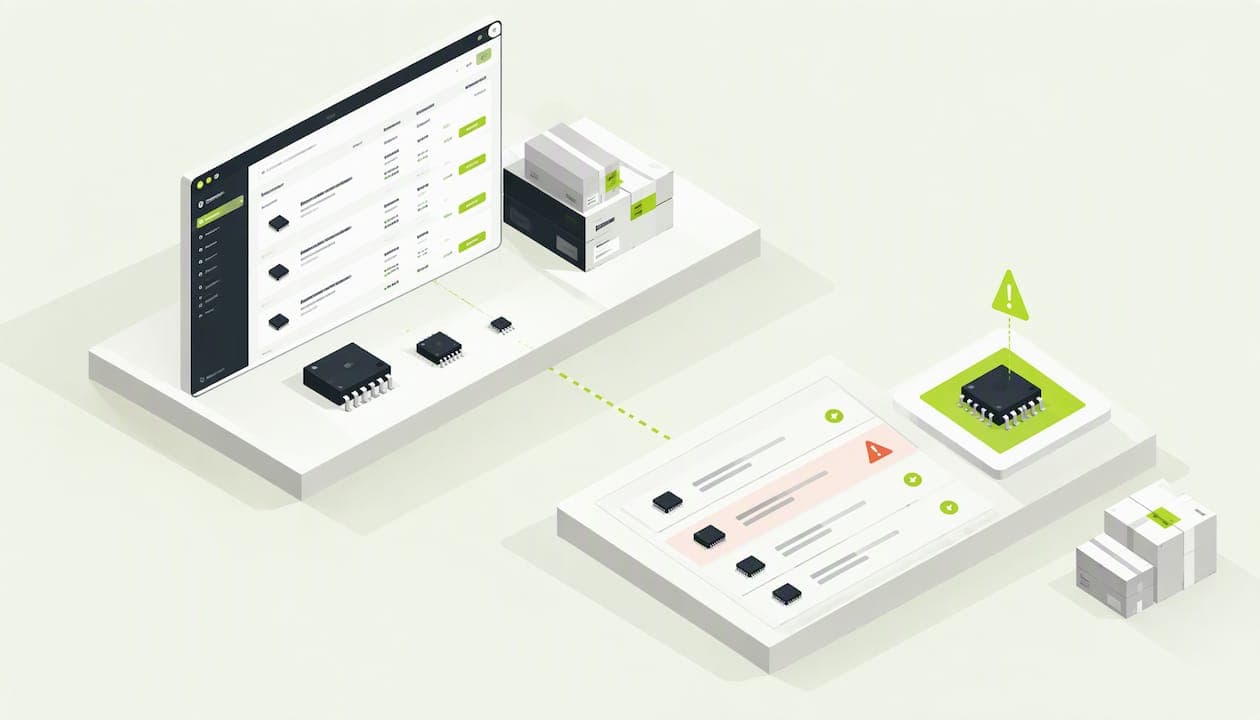
Inventory risk analysis is the work of finding which stock could lose you money or stop a build, and deciding what to do about it before it happens. For a hardware team, that means two questions per part: what happens if we hold too much of it, and what happens if we can't get it? This guide shows how to answer both with a method you can run in a spreadsheet this week, using your own BOM.
TL;DR
- Inventory risk runs in two directions: excess and obsolete stock ties up cash, while shortages stall builds. Score both.
- Start by ranking parts by annual dollar usage (ABC analysis), then score supply risk on the lines that matter most.
- Static safety-stock formulas can miss badly when lead times swing, so review buffers on a rolling basis for high-risk parts like MCUs, memory and power ICs.
- Buy from authorized channels for anything where counterfeit exposure would be costly, and give suppliers a rolling 12-month forecast.
- Re-price your BOM at your real quantity every time you review. Prices and stock move faster than your spreadsheet.
Table of Contents
- What inventory risk analysis actually covers
- Step 1: Rank every line by annual dollar usage
- Step 2: Score supply risk on each BOM line
- Step 3: Set buffers that survive lead-time swings
- Step 4: Guard against counterfeit and gray-market parts
- Step 5: Give suppliers a forecast
- Perspective: price the build before you trust the plan
- Run the analysis on your own BOM
- Excess and obsolete stock: the other half of the risk
- Common mistakes
- Frameworks for going further
- FAQ
- Sources
What inventory risk analysis actually covers
Most general guides define inventory risk as the chance of losing money because of problems with the stock you hold or need. That is correct but too broad to act on. In electronics, it helps to split it into four buckets:
- Availability risk. The part is allocated, on long lead time, or sold by a single source. You can't build.
- Excess and obsolescence risk. You bought more than you will use, or the part reaches end of life, or the design changes. Cash sits on a shelf.
- Price risk. The price at 10 pieces is not the price at 1,000, and spot prices during a shortage can be far above contract prices.
- Authenticity and quality risk. Counterfeit, recycled or mishandled parts enter the build.
A team buying 1 to 1,000 pieces of each part is exposed to these in a different way than a high-volume manufacturer. You have little buying leverage, so you feel allocation sooner. But you also have less stock to write off, so a clean process pays back fast.
Step 1: Rank every line by annual dollar usage
You can't give every part the same attention. ABC analysis, the operational form of the 80/20 rule, ranks each item by annual dollar usage, which is unit cost times annual demand. You then split the list into three control classes.
According to the same reference, typical splits look like this:
| Class | Share of SKUs | Share of annual value | How to manage |
|---|---|---|---|
| A | 10-20% | 70-80% | Tight safety stock, frequent counts |
| B | 20-30% | 15-25% | Moderate controls |
| C | 50-70% | 5-10% | Bulk orders, looser buffers |
A caution for hardware: dollar usage alone misleads. A 4 cent resistor can halt a build as thoroughly as a $40 FPGA if it is out of stock. So treat ABC as the first filter, not the final answer. Step 2 adds the filter that dollar value misses.
A worked example
Say your board has 120 unique lines and you build 200 units a year. Multiply each line's unit price by quantity per board by 200. Sort descending. You will likely find 15 to 25 lines, mostly the processor, memory, power management, connectors and the enclosure hardware, carrying most of the spend. Those are your A items. The 60 or so passives at the bottom are C items.
Now add a second column: how many approved sources does each line have? Any A item with one source goes to the top of your watch list. Any C item with one source and no equivalent footprint gets flagged too, because it is cheap to fix now and expensive to fix during a shortage.

Step 2: Score supply risk on each BOM line
A BOM that has never been assessed for sourcing risk is, in the words of one electronics supply chain guide, a liability you tend to discover during pre-production ramp-up. You can avoid that surprise with a simple scoring table. Give each line a 1 to 3 score on each factor, then add them up.
| Factor | 1 (low risk) | 2 (medium) | 3 (high) |
|---|---|---|---|
| Sources | Three or more distributors stock it | Two | One, or none in stock |
| Alternates | Drop-in second source | Needs a respin or firmware change | None |
| Lifecycle | Active, long-term supply | Mature | Not recommended for new designs or end of life |
| Lead time | Under your build cycle | Close to it | Longer than your build cycle |
| Part type | Commodity passive | Standard IC | MCU, memory, power IC or custom part |
A line scoring 12 or more is a problem. A line scoring 8 or less is probably fine. Multiply the score by the line's cost share if you want a single ranking, or just sort by score and read the top ten by eye.
Why part type belongs in the score
Industry commentary on component volatility points to MCUs, DRAM and power ICs as the categories where lead times spike and capacity gets reallocated. One commodity intelligence report argues that just-in-time buying, efficient in stable periods, becomes a liability in volatile ones. Its recommended hedges are diversified suppliers and strategic buffer inventory for the high-risk components. That is a sensible rule to build into your scoring.
Step 3: Set buffers that survive lead-time swings

The classic safety-stock formula assumes demand and lead time behave like a steady bell curve. In practice they don't. A peer-reviewed study of high-tech inventory hedging found that static safety-stock formulas can leave service levels significantly short of target, in some cases by 13 percentage points, because they ignore non-stationary demand and lead-time volatility. The authors recommend rolling-horizon models that treat production and safety stock as one system.
You don't need a research model to apply the lesson. Three habits get you most of the way:
- Review buffers on a schedule, not on a trigger. Monthly for A items with a risk score of 12 or more. Quarterly for the rest.
- Use the lead time you are quoted today, not the one in your last purchase order.
- Size the buffer in weeks of build, not units. If a part now takes 30 weeks and your build cycle is 10, you are exposed for 20 weeks. Decide how many of those you will cover with stock.
Buffer stock is not free. It is also the main source of excess risk. That is why the buffer goes on the 10 or 20 lines that could stop the build, not on the whole BOM.
Step 4: Guard against counterfeit and gray-market parts
When parts get scarce, spot-market offers appear, and some are not what they claim to be. Standards work in this area, such as SAE AS5553 on counterfeit parts avoidance, treats prevention as a risk-based practice. The guidance summarized in our research advises against trusting a "new" label alone and names buying from authorized, franchised distributors as the primary defense. That matters most in aerospace, defense and other high-reliability work.
A practical rule: set a policy per risk tier. Authorized channels only for anything safety-relevant or in a regulated product. For a hobby board, you can be more relaxed. Write the policy down, so the person under deadline pressure doesn't make the call alone.
Step 5: Give suppliers a forecast
Reactive spot buying is expensive and puts you last in line during allocation. One supply chain Q&A from an EMS provider describes a rolling 12-month outlook as the gold standard for securing supply, because suppliers are more likely to prioritize customers who share one.
Small teams often think they are too small for this. You are not. Even a one-page forecast of expected quantities per quarter, shared with your main distributor or contract manufacturer, changes the conversation. Update it quarterly and be honest about uncertainty. A forecast you revise is better than none.
Perspective: price the build before you trust the plan
We built Circuit Center for the people on the receiving end of these risks: engineers, buyers and makers who find out about a stock problem after the design is frozen. Our view is that most inventory risk in small hardware teams is a visibility problem, not a modeling problem. Nobody lacks a formula. People lack a current, line-by-line picture of price and stock at their own quantity.
That is why every search result in our catalog compares price and stock across sellers at 1, 10, 100 and 1,000 pieces, and says whether a price comes from a live distributor feed or an older listing. A stale price hides risk. A part that looks fine at 1 piece and doubles at 100 is a risk you want to see while you can still change the design.
We also think the risk review should live next to the design, not in a separate spreadsheet that drifts out of date. A priced BOM straight from the schematic means the sourcing check happens every time the design changes, not only before a purchase order. And when a missing part would cost a week, a nearby counter can be the cheapest buffer you have.
— Matthew
Run the analysis on your own BOM
Here is a one-hour workflow that uses everything above.
- Export your BOM from KiCad, Altium or Eagle, or use a spreadsheet.
- Match and price every line at your build quantity. Our BOM pricing tool matches each line to real parts and recommends a supplier per line. The file is read in your browser, and only part numbers are looked up.
- Sort by extended cost to find your A items.
- Score the A items with the table in Step 2. Note any line with a single source or a stale price.
- Pick alternates for the top five risks and record them in the BOM.
- Decide buffers for the lines scoring 12 or higher, in weeks of build.
- Share the priced list with your buyer using a share link, so the plan and the numbers stay in one place.
If you work in KiCad, you can skip the export: the Circuit Designer opens a project in the browser and prices a BOM from the catalog directly. To browse parts by category and compare distributors, start at the Circuit Center directory. Search and the BOM tool are free to use. Members, from $10 a month, can save designs and BOMs to their account.
When the analysis turns up a missing part and your schedule can't absorb a shipment, check Parts for Pickup, which maps nearby suppliers with a pickup counter.
Excess and obsolete stock: the other half of the risk
Everything above focuses on running short. The opposite failure is just as real. A component maker's trade association has pointed out that, with excess inventory in the market, it is a good time to set rational policies that stop perfectly good components being destroyed because they are out of date. See the ECIA resource for buyers and engineers for the industry's own framing.
For a small team the controls are simple:
- Buy to the break, not past it. If the 100-piece price is only 3% better than the 10-piece price, don't buy 100 for a board you will revise.
- Track shelf life. Moisture-sensitive parts, some capacitors and adhesives have limits. Record the date received.
- Tie purchases to a design revision. When the board changes, review what is left in stock and decide whether it goes to the next build, a lab drawer or a resale channel.
- Write off on a schedule. Anything untouched for 18 to 24 months gets a decision, not a shrug.
Common mistakes
- Treating all lines alike. Spending equal effort on a 2 cent resistor and a sole-source SoC wastes time.
- Trusting last quarter's lead times. In volatile markets they go out of date quickly.
- Reading a price without its source. A cached listing is not an offer you can buy at.
- Checking only at purchase. Risk changes between design freeze and the PO. Re-check at both.
- Keeping the analysis in one head. If only one engineer knows why a part has a buffer, the logic leaves with them.
Frameworks for going further
If you want a formal method, the supply chain literature offers structured tools. A 2026 study proposes a hybrid framework for assessing global semiconductor supply chain risks, aimed at developing economies. Failure mode and effects analysis (FMEA) has also been adapted to supplier selection, as in this case study. For a small team, the scoring table in Step 2 is a lightweight version of the same idea: list what can fail, rate how likely and how bad, and work from the top.
FAQ
What is the 80/20 rule in inventory?
It is the Pareto principle applied to stock: a small share of items drives most of the value. In ABC analysis, Class A items are typically 10-20% of SKUs holding 70-80% of annual dollar value. You give those items the tightest controls, and manage the long tail more loosely.
What is inventory risk?
It is the chance of losing money or missing output because of the stock you hold or fail to hold. For hardware teams that includes shortages, excess and obsolete parts, price swings and counterfeit exposure. A good analysis covers both holding too much and having too little.
How do I do an inventory risk analysis?
Rank parts by annual dollar usage, score each important line on sources, alternates, lifecycle, lead time and part type, then set buffers and alternates for the highest scores. Re-run it whenever the design, quantity or market changes. A priced BOM is the best starting data.
How often should I review inventory risk?
Monthly for your highest-risk A items, and quarterly for the rest is a workable rhythm. Also review at design freeze and before each purchase order, since lead times and stock can change between the two.
Sources
- ABC Analysis: Pareto-Based SKU Classification Calculator
- Electronics Supply Chain Resilience: Component Sourcing Strategy and BOM Risk Management
- Commodity Intelligence Report, Q3 2025 sample
- Inventory hedging study, Flexible Services and Manufacturing Journal
- SAE AS5553: Counterfeit EEE parts avoidance, detection, mitigation, disposition
- Ensuring supply chain transparency in your EMS relationship
- ECIA Offers Resource for Component Buyers and Engineers
- Global Semiconductor Supply Chain Risk Assessment and Mitigation
- A modified FMEA method for supplier selection